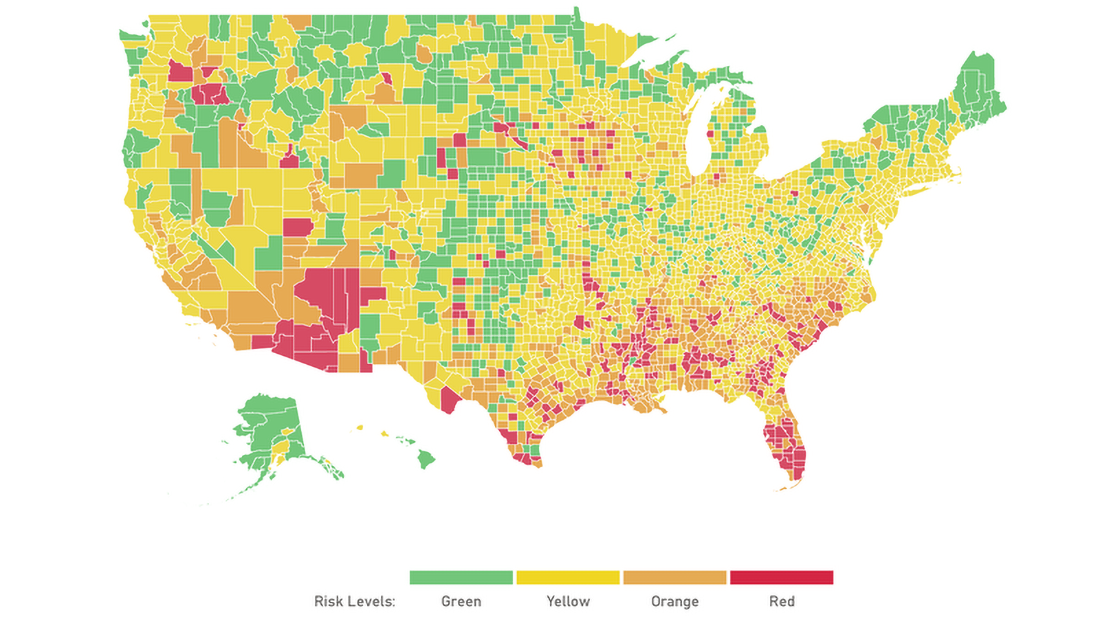
03 Jul Green, yellow, orange or red? This new tool shows COVID-19 risk in your county
By Allison Aubrey and Carmel Wroth, NPR
How severe is the spread of COVID-19 in your community? If you’re confused, you’re not alone. Though state and local dashboards provide lots of numbers, from case counts to deaths, it’s often unclear how to interpret them — and hard to compare them to other places.
“There hasn’t been a unified, national approach to communicating risk, says Danielle Allen, a professor and director of the Edmond J. Safra Center for Ethics at Harvard University. “That’s made it harder for people,” she says.
Allen, along with researchers at the Harvard Global Health Institute, is leading a collaboration of top scientists at institutions around the country who have joined forces to create a unified set of metrics for the coronavirus pandemic, including a shared definition of risk levels — and tools for communities to fight the virus. Read more …